As we reach the peak of summer and the 2024 Summer Olympic Games occurring in Paris, this issue of Tom’s Takes provides insight into Walmart’s investment plans within its grocery distribution network and a recap on the 2024 State of Logistics Report by CSCMP and its contributing partners.
Walmart Grocery Network Transformation
On July 10th, Dave Guggina, Walmart’s EVP of U.S. Supply Chain Operations, drafted a summary of their improvement plans for the largest U.S. grocer, including five new distribution centers (DCs) with an expected 2,000 jobs to be added to the communities where they are building or have been built. Those cities include:
- Shafter, CA – operational since 2021
- Lancaster, TX – currently ramping up operations
- Wellford, SC
- Belvidere, IL
- Pilesgrove, NJ
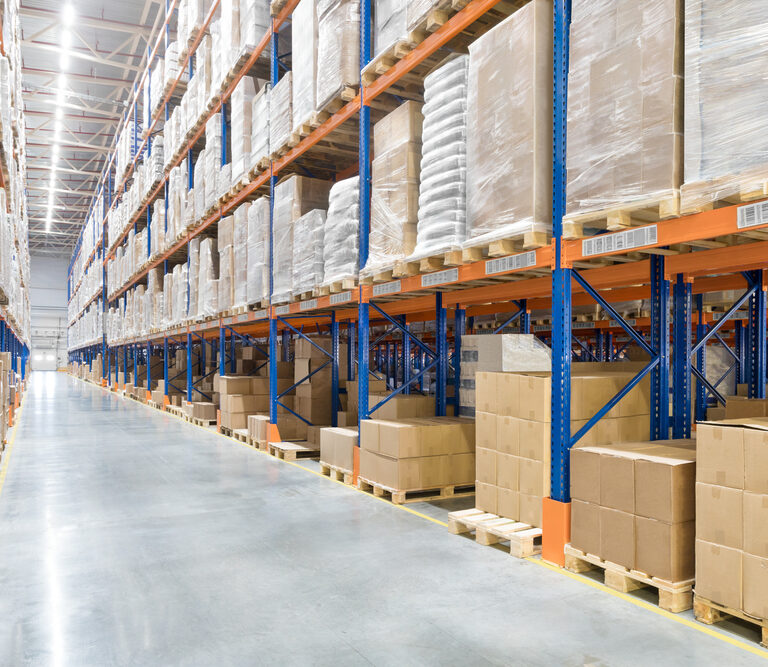
In addition to the five new DCs listed above, Walmart is expanding four perishable DCs that will add over 500,000 square feet of additional space and retrofitting their Winter Haven, FL perishable DC with technology and automation improvements. One of the goals of the retrofit is to understand the impact and feasibility of the automation improvements for future facilities.
Guggina recently said, “As customers change the way they shop, we’re taking steps to build even more trust with them, ensuring the things they want – and need – are on shelves faster than ever before. To do that, we’ve been investing in data, increasingly intelligent software and automation – all to transform our business and create a more connected supply chain.”
2024 State of Logistics Report
The 35th Annual State of Logistics Report published by CSCMP and Kearney in June, as reported by Supply Chain Digest, showed a contraction in year-over-year U.S. business logistics costs (USBLC) by 11.2% from $2.67 trillion in 2022 to $2.37 trillion between 2023 and 2022.
USBLC is comprised of three cost categories:
- Transportation Costs – all modes
- Inventory Carrying Costs – includes storage costs
- Other Costs – such as IT and freight forwarding
As expected, transportation costs comprise the largest component of USBLC at 63.1%, followed by inventory and warehousing at 29.4% and other costs at 7.4%.
Within transportation, all modes expect pipeline experienced a year-over-year reduction, with an overall reduction of $250B, which equated to 14.3%. Parcel remained flat at $215.7B with a modest 0.5% year-over-year decrease.
On the inventory side, costs were down 7.8% year over, with storage costs down $30B, inventory carrying costs $11B, and other costs, such as shrinkage, obsolescence; etc. down $18B.
Over the 5-year period from 2019 to 2023, which includes the global pandemic years of 2020 and 2021, USBLC experienced a compounded annual growth rate (CAGR) of 7.4%, with parcel shipping and water having the largest CAGR percentage increases at 11.2 and 18.2% respectively. LTL trucking was the only line item to show contraction over the past years, dropping from $75.1B to $64.0B.
Tom’s Take: “Automation initiatives within the supply chain will continue to drive improved performance and customer satisfaction via same-day pick and delivery execution. The grocery industry has consistently been an early adopter within the supply chain to implement technology into its operations to help fuel customer growth and differentiate itself from its competition.
The contraction in USBLC in 2023 is reflective of the global economy shrinkage. However, the five-year CAGR trends for all three cost components have seen steady single-digit growth over that same period.”


