Over the last six months I have been reaching out to our retail clients to understand how the economy is affecting their overall business. Time and again, I am being told the same thing, “Our retail comp sales are in the negative double digits.” In other words, comparative retail sales from 2008 over 2007 are negative 5% to negative 20%. While most retail clients predicted and some planned (NOT ALL) for negative comp sales in 2008 (-3% to -5%), many did not plan for negative double-digit comp sales in November, as was the case for many retailers. Many clients are running into credit line issues because they are over leveraged with purchase orders (incoming merchandise), or they are constrained by store real estate contracts (new and existing) that cannot be terminated. Bottom line retail sales are down, retailers are over leveraged, and end consumers are over leveraged with credit card debt, equity lines of credit and bad mortgages. Did I mention our banking system? I will save that for another day.
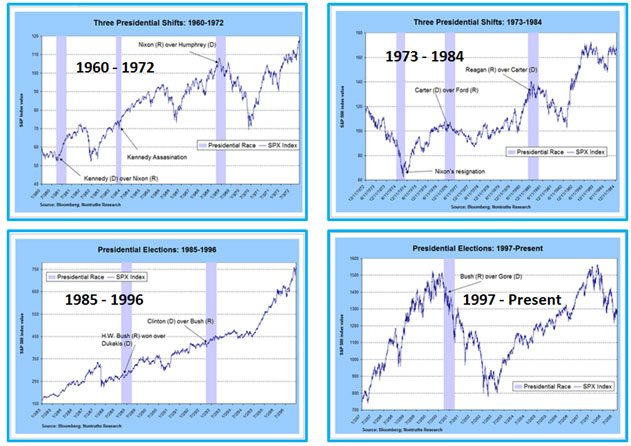
What I find interesting is that that the state of economy is rather predictable! I realize that this is a bold statement. So where is my empirical evidence and statistical data to back up my statement? I don’t have a statistically proven model to offer, but if we look over the last twenty eight years, starting from 1960 to present day, the stock market (S&P 500) has tumbled during Presidential elections. (Refer to Bloomburg illustrations below).

You do not need to be an economist or have a Masters in macro economics to google “presidential election & stock market.” There is overwhelming amount of information, facts and data from the last twenty years that explicitly demonstrate that a Presidential race creates UNCERTAINTY! It is UNCERTAINTY in the eyes of consumers that has a created an economic change reaction, hence dismal retail sales. UNCERTAINTY creates fear and when there is fear people retreat and stop spending. Consumers revaluate, and prioritize what is important. So why did organizations (regardless of industry) not plan for this economic down turn in 2006 and start executing enterprise cost management strategies in 2007? The information was just a click away.
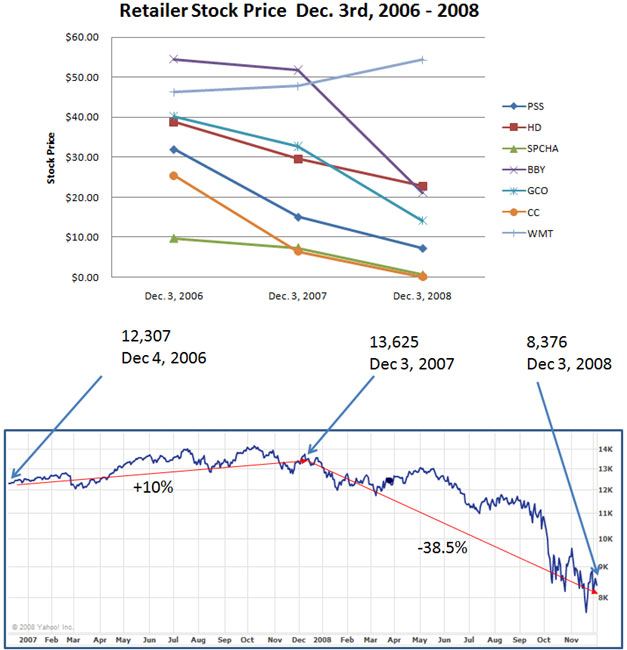
I did some quick research on the following retailers (Genesco-GCO, Collective Brands-PSS, Best Buy-BBY, Circuit City-CC, Wal-Mart-WMT, Sport Chalet-SPCHA, and Home Depot-HD). With the exception of Wal-Mart and Home Depot, the previously named retailers have lost over 50% of their value from December 3, 2006 to 2008 (closing prices as of December 3, 2008. Reference below illustration). The stock market (DOW Jones) has decreased 31% over the same time period. However between the week of December 1st, 2006 and December 1st, 2007 the DOW Jones increased by 10.75% while the retail company stocks listed below were in a negative spiral. Note the week of December 3rd, 2007 is when the DOW started in a negative trend line from 13,625 to 8,376 (as of December 3rd, 2008).

Common sense tells us the strong will survive, companies that manage cash vs. EBITA will win and those who develop two- to three-year strategic strategies based upon economic analysis (governmental monetary and fiscal policy) will come out ahead. The question is why?
I believe it is two-fold: 1) the retailers that are surviving provide value through discount prices and, in most cases, exceptional customer service, and 2) the retailers that are surviving and will continue to survive are constantly seeking efficiencies in their supply chains. They are squeezing every penny from source to consumption. I am not a Wal-Mart lover but you have to give credit where credit is due. Wal-Mart’s entire business model is focused on cost containment, cost reduction or cost postponement (Southwest Airlines falls into this category as well). I believe it is this relentless 24/7 and 365 days a year focus on COST that is the difference.
So for retailers and distribution-centric organizations that are struggling to keep costs in line with lackluster sales, I have provided a few short-term, cost-cutting opportunities.
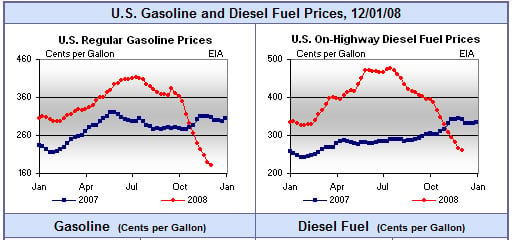
- Evaluate all transportation contracts (implementation 4 to 8 weeks): Ocean, Rail, FTL, LTL and Parcel. Both gas and diesel prices have decreased over the last three months and are lower than January 2007 prices Are you paying for fuel surcharges, and if so, why? Reference illustration below.

- Evaluate Transportation Outsourcing (implementation 8 to 12 weeks): Unfortunately, mid-market ($75M to $500M) and some large retail organizations lack World Class Transportation groups. There is a lack of talent, technology and focus on optimization. Outsourcing to a NON-Broker transportation management firm can provide immediate best of breed technology, economy of scale on carrier lanes and contracts, and a talent pool that is focused and educated from some of the best universities in the country. You need and want transparency, but there are hidden costs with a broker. Evaluate a transportation outsourcing firm that has proven technology and talent. At a minimum, hire a transportation consultant to evaluate your transportation team.
- Metrics, Metrics and more Metrics (4 to 12 weeks): specifically for distribution labor. Are you measuring at least single variable, and preferably multi-variables, with respect to labor performance? Many organizations lack the methods, measurements and motivation to drive performance and cost reduction. More importantly, providing continuous feedback to associates as to where they stand, yields great returns. You don’t always need an elaborate Labor Management System (LMS) to improve productivity. Distribution managers typically know who performs and who does not. I have seen 10% increases in productivity, which can equate to labor reductions of 4-8%, simply by telling people what you expect and when you expect it by.
- Focus on eliminating WASTE (4 to 12 weeks): there are 5 key areas, or MUDA. I will focus on number 4 & 5 (see bullet points below). The largest labor cost in a DC is picking labor (full case, and each picking), therefore SLOTTING plans and solutions can help reduce walking distance between picks. Optimized slotting can reduce labor picking labor from 5% to 20%. In addition, balancing work-load between areas based upon constraints significantly improves productivity. Distribution Centers need to think like manufacturers. Manufacturers use production planning (master planning) and scheduling solutions to improve the flow of raw materials, and to ultimately produce finished goods. In addition, manufacturers incorporate LEAN principles and theory of constraints (TOC) to balance material flow. Take the time to understand your constraints and balance the flow of merchandise based upon the constraints, (go read, The Goal by Eli Goldratt), apply it to your DC, and stop thinking like a distributor and more like a manufacturer.
- Mistakes that require rectification (DEFECTS)
- Production or purchasing of inventories that know no one wants (OVER PRODUCTION & INVENTORIES)
- Process steps that are not actually needed (PROCESSING)
- Movement of employees and transport of goods from one place to another without any purpose (MOTION & TRANSPORTATION)
- Groups of people standing around because upstream processes have not delivered on time (WAITING)
- Goods and services that do not meet the needs of the customer
- Break your Policy Constraints (unfortunately implementation 8 – 16 weeks): often DC labor hours, schedules and allocations are not balanced with store labor and store sales. Evaluate alternative shift schedules that improve the flow of merchandise from the DC to the back stock room of the store. I am amazed that the majority of retailers do not align their labor between the DC, store, and transportation lead times. Specialty retailers (Sporting Goods, Shoes and Apparel) experience 50% of their sales on a Friday, Saturday and Sunday. However, DC labor works Monday to Friday. Labor forecasting and scheduling should start at the cash register (POS) and work backwards to the receiving dock of the DC. We have seen retailers eliminate non-service (customer facing) tasks by role splitting and moving to dedicated stocking. This improves conversion because sales people are selling and not performing non-service tasks. In addition, your DC needs to provide store-ready merchandise for direct put-away. Our last client experienced over a $1m in labor reduction by balancing their entire supply chain (source to consumption) workforce. While they increased their DC labor, it was offset by store labor reduction. Remember – global vs. local optimization.
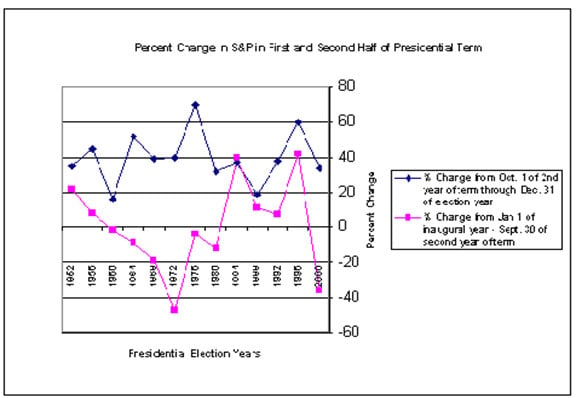
There are numerous opportunities for cost savings if you are focused (focus is the key to execution). In my humble opinion, the FUTURE is not bright. Using the Presidential elections as a litmus test, the two years following a new President’s inaugural speech (for the last 15 stock market cycles) have been bear markets (average length of time is 1.87 years), compared to the last two years of the President’s term which have been bull markets [1]. The illustration below show the cumulative dollar difference between the first half of the Presidential term and the second half of the Presidential term.

Final Thoughts
Retailers need to evaluate short-term cost containment measures by focusing vigorously on waste reduction throughout the entire organization. But more importantly, investing in the future with long- term financial and growth goals, specifically in the areas of talent management, continuous education, realignment of the organizational structure from merchandising centric to supply chain centric (cross functional source to consumption), and enabling technology. In addition, focus on core competencies and outsource organizational areas that are not core competencies. I am frustrated with merchandising-centric leadership teams driving their companies into the ground because they are not focused on the right goals. If your CEO is an ex-merchant, buyer and/or entrepreneur, please surround him or her with Supply Chain Management talent that are focused on enterprise cost management.
In closing, I’d like your thoughts about who dropped the ball at Circuit City. How can a company that less than seven years ago was used as a poster child organization in the book Good to Great by Jim Collins, wind up filing bankruptcy on November 10th of this year? I am not trying to be harsh, I am just keenly interested. I have business colleagues and friends who work for Circuit City so I sincerely want to know! Did they get away from their “4-S” model: service, selection, savings and satisfaction? What can we learn from them?
Always enMotion,
Jim Barnes


